
Author- Pankaj Gothi, COO- Laboratory Division, SWA Environmental Private Limited
What is method validation & why it’s necessary to validate the methods?
Method validation is the process of determining whether a given testing method can consistently deliver reliable, accurate, and reproducible results across multiple trials. This involves evaluating both the repeatability within a laboratory and the reproducibility across different laboratories, ensuring that the method stands up to statistical scrutiny.
As we know, there are always two types of methods whenever you adopt one— the method is either standard or non-standard.
- If the method adopted for testing is standard, then it’s already believed to be extensively validated by intra-laboratory studies and statistically significant samples, along with measurement uncertainty
- But if the methods are non-standard, developed in-house, or modified from a standard, then the method requires validation.
Method Validation for Pesticides in Gas Chromatograph
First, you need to get the resource requirements according to the method, like: Reference materials, Glassware, Instruments, Reagents, Analytes, Instrument variability etc.
Following are key parameters to check for method validation in Gas Chromatography:
- Specificity/Selectivity:
Ability of the method to distinguish the target analyte from other components in the sample. Ensures no interference from other substances. - Accuracy & Recovery:
Measures how close the results are to the true value.Usually expressed as percentage recovery of known added standards, like verifying against reference materials. - Precision:
Precision means consistency of method results when measuring. It includes:
- Repeatability: Consistency of results under similar conditions (same analyst, instrument)
- Reproducibility: Consistency under different conditions (different labs, analysts, instruments)
Calculate Standard Deviation (SD) and Relative Standard Deviation (RSD) from these.
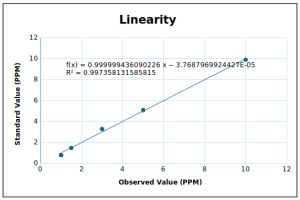
- Linearity:
Assesses if the method provides results proportional to analyte concentration within a specific range.
Determined by plotting a calibration curve and assessing the correlation coefficient (R²). - Range:
Range is derived from linearity — the minimum and maximum concentrations that the method can measure reliably under acceptable criteria. - Limit of Detection (LOD):
People often confuse LOD and MDL — they are different.
- LOD is the smallest concentration that can be detected but not necessarily quantified.
- It means you can detect the analyte but cannot reliably quantify it.
The Minimum Detection Limit (MDL) is always lower than LOD. When your results approach LOD, measurement uncertainty increases. If analyte is detected but not quantified, you can only report that it is present.
- Limit of Quantification (LOQ):
LOQ is the lowest concentration you can quantitatively measure with acceptable accuracy and precision.
It is higher than LOD.
Note: LOQ is not a “maximum detection limit” — that term is incorrect technically.
- Robustness:
After method development, robustness must be tested to ensure small variations (temperature, pH, humidity) don’t affect results. - Ruggedness:
Validated methods must be rugged — meaning the method works reproducibly under normal lab conditions, across different labs, instruments, and analysts. - Measurement Uncertainty:
Degree of confidence in measurement results, including all errors and uncertainties in the process. - Stability:
Method stability checks whether the analyte or parameter remains stable during storage, preparation, and analysis.
A detailed step by step worksheet for METHOD VALIDATION for pesticide residue analysis by Gas Chromatography is provided her with — necessary for labs aiming to ensure their methods are reliable, reproducible, and compliant with international accreditation standards like ISO/IEC 17025 & NABL.
As we discussed the method validation, with the example of Organochlorines Pesticides in Water, the same can be applied to other parameters in water
| Method Validation for Organochlorine Pesticides (OCPs) | |||||||||||
| Discipline Matrix | Water/Wastewater | Date of Analysis: | |||||||||
| Parameter Name | p, p’- DDT | QM/Verified by: | Urv Patel | ||||||||
| Method Reference: | EPA 8081 B: 2007 | TM/Supervised by: | Pankaj Gothi | ||||||||
| Instrument Details | Gas Chromatography -1110 | Analyst: | Rekha Karavadra | ||||||||
| 1 | Sample Preparation | EPA 8081 B: 2007 | |||||||||
| 2 | Stock Standard Details | 20 ppm | |||||||||
| 3 | Working Range | 1.0, 1.5, 3.0, 5.0, 10.0 ppm | |||||||||
| 4 | Calibration Graph Details | Attached | |||||||||
| 5 | Performance Characteristics | ||||||||||
| 5.1 | Linearity R2 Value | 0.997 | |||||||||
| SD/LOD/LOQ of Linearity | SD (Standard Deviation) | 0.188 | |||||||||
| LOD (Limit of Detection) | 0.619 | ||||||||||
| LOQ (Limit of Quantification) | 1.877 | ||||||||||
| 5.2 | Accuracy % /Recovery (RSD%) | 4.573 | |||||||||
| 5.3 | Precision and Repeatability (RSD%) | 3.408 | |||||||||
| SD/LOD/LOQ of Repeatability of lowest Std | SD (Standard Deviation) | 0.034 | |||||||||
| LOD (Limit of Detection) | 0.112 | ||||||||||
| LOQ (Limit of Quantification) | 0.341 | ||||||||||
| Validation | p, p’- DDT | ||||||||||
| 1 | Linearity | ||||||||||
| Acceptance Criteria: | R2 ≥0.995 | R2 Value | 0.9974 | ||||||||
| Accepted or Rejected: | Accepted | ||||||||||
|
|||||||||||
| Amount in ppm | Calculated amount in ppm | ||||||||||
| 1 | 0.778 | ||||||||||
| 1.5 | 1.4617 | ||||||||||
| 3 | 3.2722 | ||||||||||
| 5 | 5.0834 | ||||||||||
| 10 | 9.9045 | ||||||||||
| Calibration Curve & Regression Analysis | y = 1x – 0 | ||||||||||
| Slope (m) = | 1.0000 | ||||||||||
| Intercept (c) = | 0.0000 | ||||||||||
|
|
|||||||||||
| III | Limit of Detection & Quantification as per calibration graph | ||||||||||
| Sr No | Standard Concentration in ppm | Observed Concentration in ppm | Predicted Concentration | Residual Concentration (observed-predicted) | Std. Dev. of Residual Concentration | ||||||
| 1 | 1 | 0.7780 | 1.000037124 | -0.2220 | 0.1877 | ||||||
| 2 | 1.5 | 1.4617 | 1.500036842 | -0.0383 | |||||||
| 3 | 3 | 3.2722 | 3.000035996 | 0.2722 | |||||||
| 4 | 5 | 5.0834 | 5.000034868 | 0.0834 | |||||||
| 5 | 10 | 9.9045 | 10.00003205 | -0.0955 | |||||||
| SD | √[ ∑X-Xavg.)2 / (n-1) ] | 0.1877 | |||||||||
| LOD PPM | 3.3SD | 0.619 | |||||||||
| LOQ PPM | 10SD | 1.877 | |||||||||
| II | Accuracy: % Recovery | ||||||||||
| Sample No. | Concentration in units | Observed Value Against STD | Result (X) in Units | % recovery % R | RSD % | Acceptance Criteria | Accepted or Rejected | ||||
| 1 | 1.00 | 0.952 | 0.95214 | 952 | 4.573 | Recovery between 75 – 125 % | Accepted | ||||
| 2 | 1.000 | 0.99977 | 1000 | ||||||||
| 3 | 1.043 | 1.04344 | 1043 | ||||||||
| Average | X or X avg. | 0.998 | 998 | ||||||||
| SD | 0.046 | ||||||||||
| III | Precision and Repeatability: | ||||||||||
| Acceptance Criteria: | RSD < 20% | Accepted or Rejected: | Accepted | ||||||||
| Sample No. | True Concentration in ppm | Observed Concentration in ppm | Area in (mv*min) | Peak Height in (mv) | RSD % ( Area) | RSD % (Peak Height) | RSD % (Observed conc.) | ||||
| 1 | 1.00 | 0.987 | 13.832 | 122.427 | 3.41 | 7.41 | 3.408 | ||||
| 2 | 1.00 | 0.952 | 13.349 | 124.479 | |||||||
| 3 | 1.00 | 1.017 | 14.257 | 136.928 | |||||||
| 4 | 1.00 | 1.043 | 14.629 | 146.688 | |||||||
| 5 | 1.00 | 1.000 | 14.01675 | 132.6305 | |||||||
| Average | 0.9998 | 14.017 | 132.631 | ||||||||
| SD | 0.0341 | 0.4776 | 9.8316 | ||||||||
| 2 | Limit of Detection, Quantification of Repeatability of Lowest Standard | ||||||||||
| Sr No | Standard Concentration in ppm | Observed Concentration in ppm | Predicted Concentration | Residual Concentration (observed-predicted) | Std. Dev. of Residual Conc | ||||||
| 1 | 1.000 | 0.987 | 1.000037124 | -0.0134 | 0.0341 | ||||||
| 2 | 1.000 | 0.952 | 1.000037124 | -0.0479 | |||||||
| 3 | 1.000 | 1.017 | 1.000037124 | 0.0169 | |||||||
| 4 | 1.000 | 1.043 | 1.000037124 | 0.0434 | |||||||
| 5 | 1.000 | 1.000 | 1.000037124 | -0.0003 | |||||||
| SD | √[ ∑X-Xavg.)2 / (n-1) ] | 0.0341 | |||||||||
| LOD PPM | 3.3SD | 0.112 | |||||||||
| LOQ PPM | 10SD | 0.341 | |||||||||